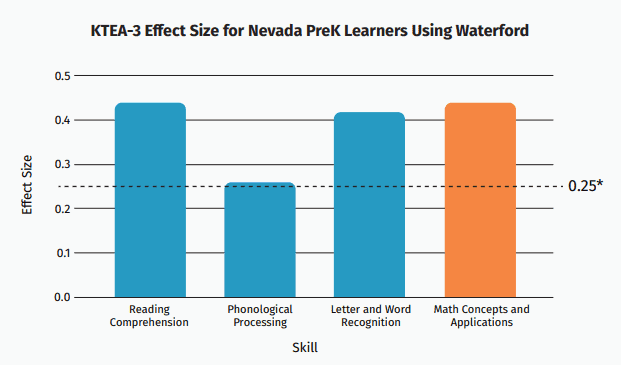
As Education Revenue Declines, How Has It Impacted You?

SHARE:

For the first time since 1977, public elementary and secondary education revenue declined in fiscal year 2012. The U.S. Census Bureau recently released these new findings, showing public elementary and secondary school systems receiving $594.5 billion in total revenue in fiscal year 2012, down $4.9 billion (0.8 percent) from fiscal year 2011.

State governments were the leading source of revenue ($270.4 billion), followed by local sources ($264.6 billion); the majority of revenue from local sources came from property taxes (65.3 percent). Public school systems received $59.5 billion in revenue from the federal government, a decrease of 19.2 percent ($14.2 billion) from the previous fiscal year.

So what were some reported statistics on spending?

  • The 50 states along with the District of Columbia spent $10,608 per student on public elementary and secondary education in 2012, the same amount in 2011.
  • The top spenders per student were New York ($19,552), the District of Columbia ($17,468), Alaska ($17,390), New Jersey ($17,266) and Connecticut ($16,274).
  • States spending the least amount per student in 2012 were Utah ($6,206), Idaho ($6,659), Oklahoma ($7,466), Arizona ($7,559) and Mississippi ($8,164).
  • Of the $593.8 billion in total expenditure for public school systems, $524.0 billion is consist of spending for day-to-day operation of schools and school districts.
  • The largest expenditure category for public elementary and secondary education were instructional salaries, totaling $206.7 billion in 2012 (34.8 percent of total spending).

You can read additional highlights from the report here.

Have you noticed any revenue or spending changes in your school or district? If so, how has it affected you?

SHARE:

More education articles